OpEx vs. CapEx
The Commercial HVAC Battle You Can Finally Win
As a multi-site facility manager, you live in the gap between Capital Expenditure (CapEx) and Operational Expenditure (OpEx). Your CFO demands you cut OpEx (maintenance and energy bills), but they hesitate to approve CapEx (new equipment).
You're stuck in the middle, endlessly funding repairs on aging commercial HVAC rooftop units (RTUs), chillers, and boilers that keep breaking down. It’s the definition of insanity: repeatedly paying for emergency service on the same equipment, only to have it fail again.
It's time to change the conversation with finance by proving that keeping an old system running is actually costing the company more than replacing it. The key to this is understanding and calculating the Crossover Point.
What Is the Crossover Point?
The Crossover Point, in facility finance, is the moment when the cumulative repair costs and rising operational inefficiency (OpEx) of an aging asset equal or exceed the estimated cost of a full replacement (CapEx).
Think of it this way: Every dollar spent on an old unit is a dollar that isn't funding a new, high-efficiency one. When the two lines cross on a graph, the financially responsible decision shifts from "Repair" to "Replace."
The Two Financial Drains of Aging HVAC
Older commercial HVAC equipment drains your budget in two critical ways that you must quantify for your CFO:
1. The Direct Repair Cost (OpEx Spike)
Every time a unit fails, you hit the OpEx budget hard. This is where your detailed service reports become your best weapon. You must move past simply tracking the total bill and categorize it by unit.
- Emergency Premiums: An emergency repair often costs 25% to 30% more than a scheduled service call due to after-hours labor and rush-parts charges. The Department of Energy (DOE) estimates that organizations can achieve a 50% reduction in total maintenance costs by shifting from reactive to comprehensive planned maintenance programs. [1]
- The 50% Rule: A good rule of thumb—and a strong metric for your argument—is that once the cumulative repair costs of a unit exceed 50% of the cost of a new replacement unit, you have reached a critical point of diminishing returns. [2]
2. The Hidden Energy Cost (Efficiency Erosion)
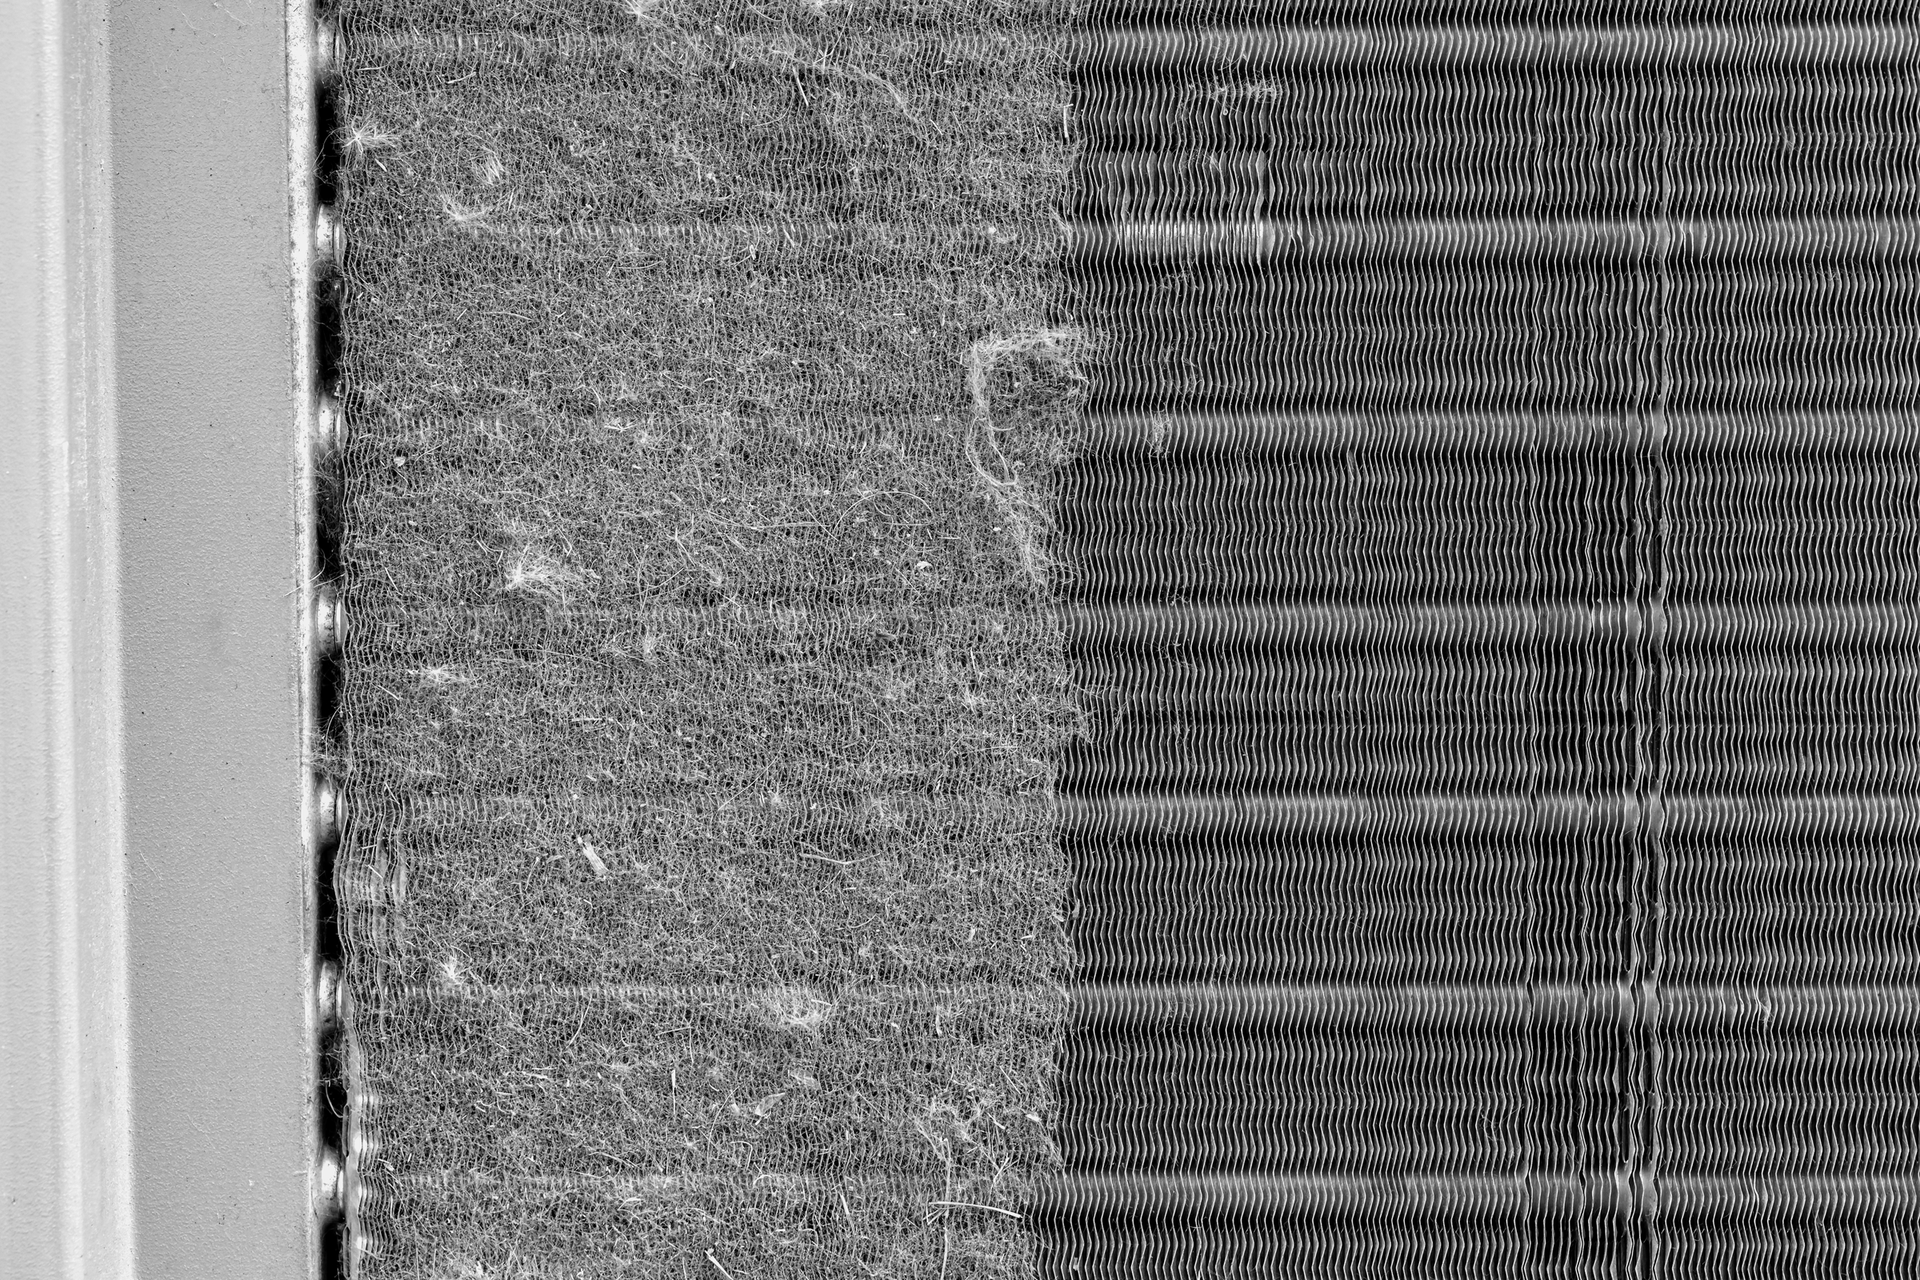
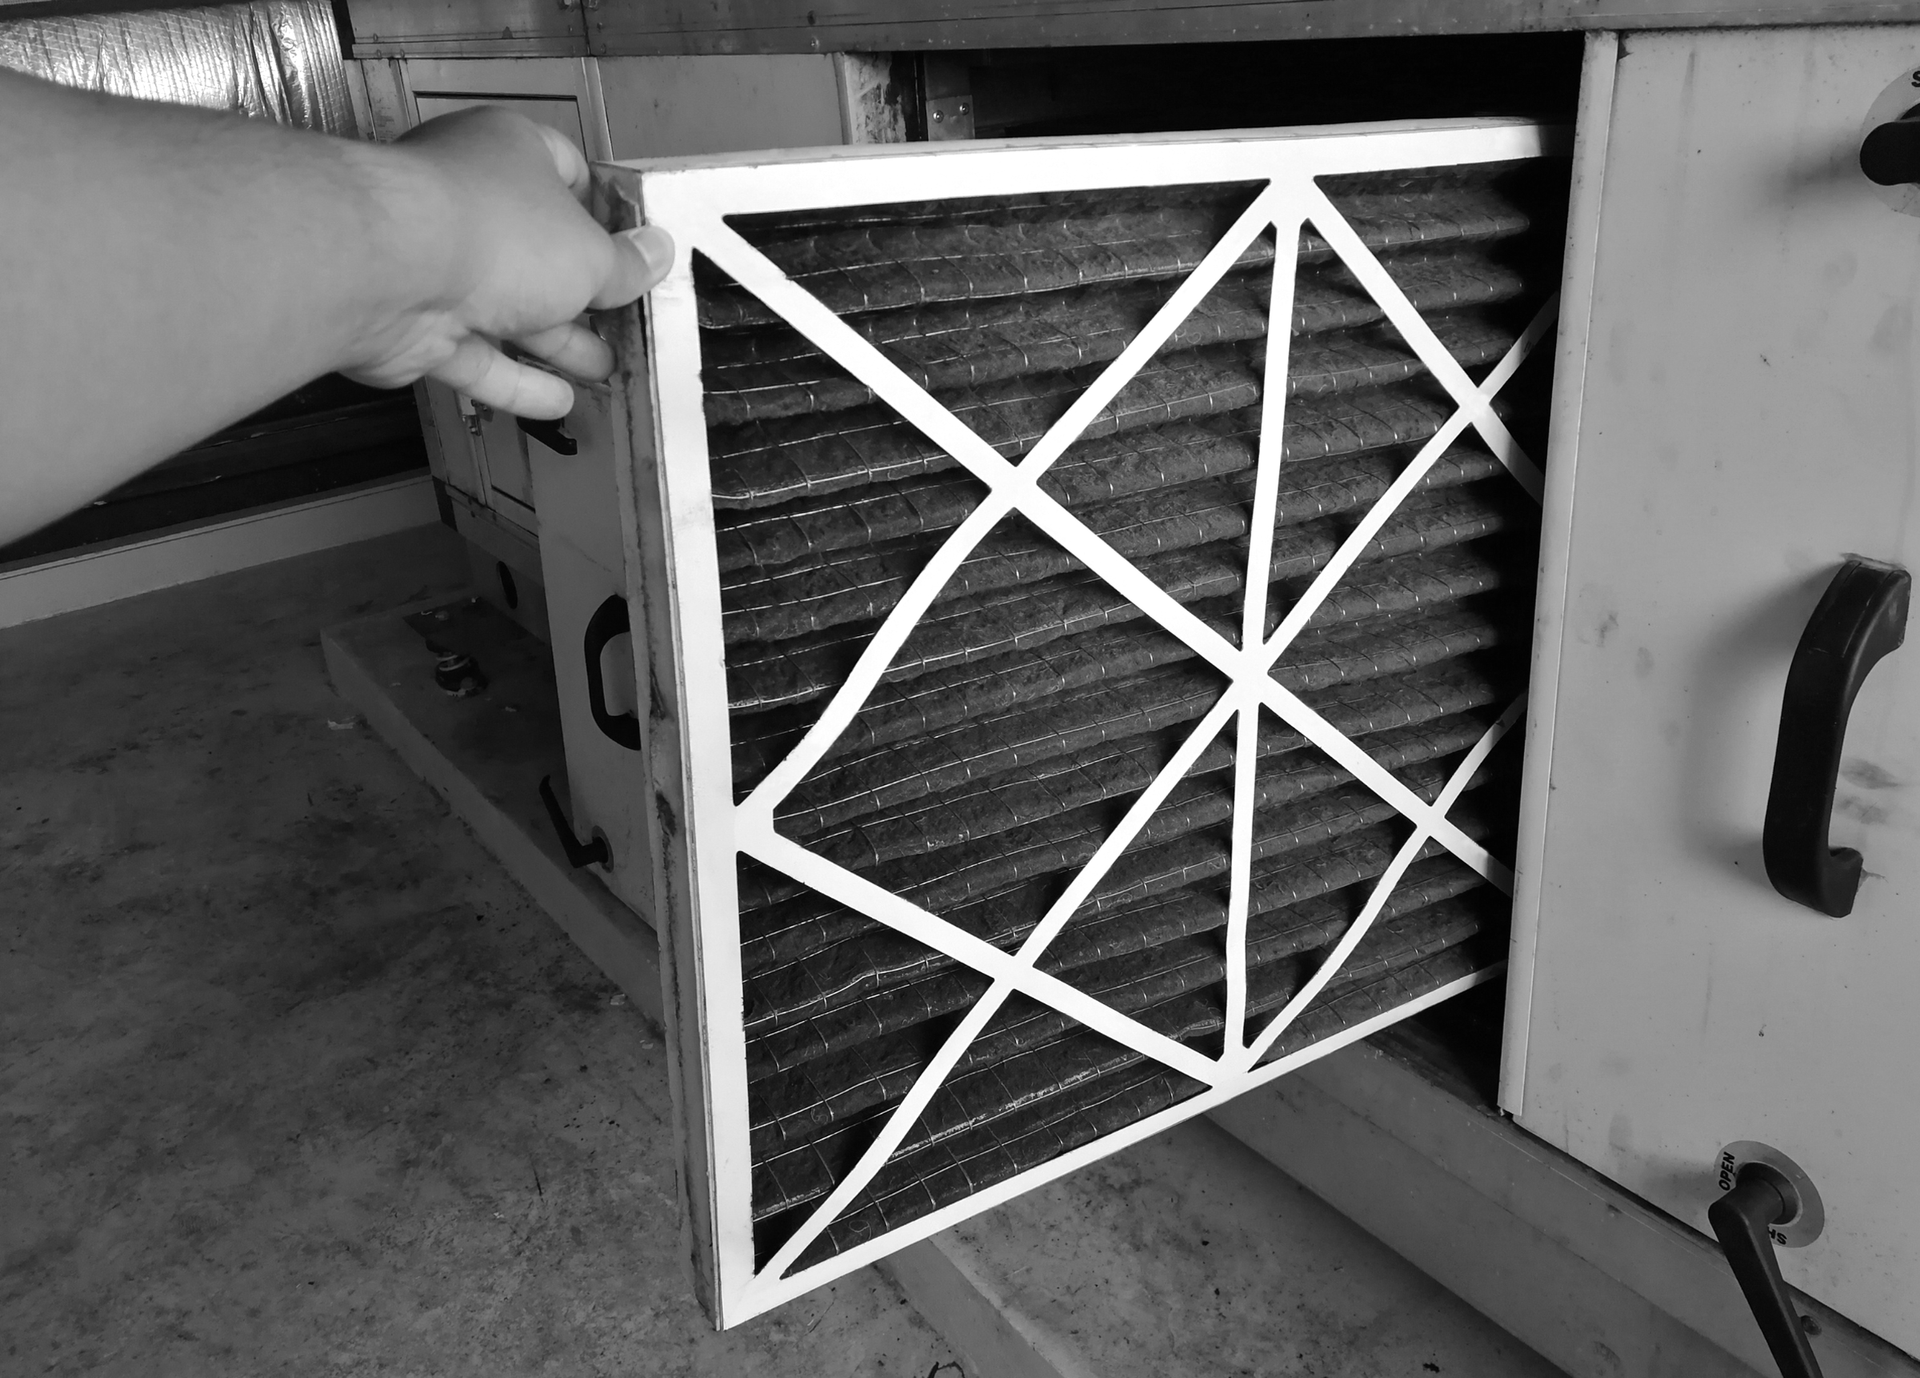
Your old equipment wasn't just built to lower standards; its efficiency degrades over time. Dirty coils, aging compressors, and leaky ductwork force the system to run longer to meet the thermostat setting.
- Massive Energy Waste: Well-maintained commercial HVAC systems achieve up to 10%–20% lower energy usage than neglected ones through performance tuning. [3] An older, poorly maintained system can increase energy consumption by 30% or more. [4]
- The SEER/IEER Gap: When a 15-year-old RTU with a low efficiency rating is replaced with a new unit featuring a high Integrated Energy Efficiency Ratio (IEER), the annual energy savings can be substantial, often representing a significant portion of the new equipment's cost. This saving is the fuel for your CapEx justification.
How to Calculate and Win with the Crossover Point
As the manager of a large, outsourced portfolio, your goal is not to perform the repair but to gather the data that proves the replacement is necessary.
Step 1: Centralize and Standardize Your Data
Work with your vendors to ensure every invoice is tagged with the specific Asset ID (Unit Serial Number) and the Cost Category (e.g., Compressor Replacement - CapEx vs. Filter Change - OpEx).
You need to track the following per unit:
- Original CapEx (or last replacement cost).
- Total Cumulative Repair OpEx over the past 3-5 years.
- Estimated Annual Energy Consumption (if available via smart sensors or utility bills).
- Estimated Replacement CapEx for a modern, high-efficiency equivalent.
Step 2: Identify the "Zombie" Units
Run a report on your entire portfolio to find the "zombie" units—the ones that refuse to die and continually eat up your budget.
- High Repair Frequency: Units with three or more major repairs (e.g., compressor, coil, fan motor) in the last two years.
- Repair Cost Exceeds Threshold: Any unit where the Total Cumulative Repair OpEx is nearing or crossing that 50% threshold of the Estimated Replacement CapEx.
Step 3: Present the Business Case (The Crossover Chart)
Instead of sending your CFO a list of broken equipment, show them a simple chart comparing two scenarios over five years:
| Metric | Scenario A: Run-to-Failure (OpEx) | Scenario B: Immediate Replacement (CapEx) |
|---|---|---|
| Year 1-5 Cumulative Repair Cost | High (Including emergency premiums) | Low (Only planned PM/Warranty work) |
| Year 1-5 Cumulative Energy Cost | Baseline or Rising (Inefficiency) | Significantly Reduced (High IEER Savings) |
| Year 1-5 Total Cost | A high and unpredictable number | A lower, predictable number |
| Customer Impact | Frequent store/branch closures, complaints | High comfort, consistent operation |
The "Crossover Point" is the year (often year 2 or 3) where the total cumulative cost of Scenario A becomes higher than the total cumulative cost of Scenario B (the replacement cost plus minimal planned maintenance).
Final Thoughts and Your Next Move
The transition from a reactive "Break/Fix" operation to a strategic "Predict and Replace" model starts with clean data. You are the only person who can connect the dots between an emergency call that could cost $4,500 in OpEx and the lost customer loyalty at the retail level. By quantifying the cost of inaction, you shift the conversation from a request for spending to a plan for long-term profit protection and operational stability. You stop managing breakdowns and start managing assets.
So stop thinking of replacement as an expense. Instead, frame it as a financial tool for profit protection.
When you walk into that budget meeting, you won't be asking for permission to spend money; you will be presenting a plan to save money, reduce risk, and guarantee operational continuity across your entire chain. Use that Crossover Point analysis to demonstrate that delaying CapEx is the single riskiest financial decision the company can make. The data is on your side—now go use it to secure your future budget and upgrade your portfolio.
Sources Cited
[1] U.S. Department of Energy, Federal Energy Management Program (FEMP): https://www.energy.gov/sites/prod/files/2020/04/f74/omguide_complete_w-eo-disclaimer.pdf
[2] ASHRAE: https://www.ashrae.org/technical-resources/aedgs
[3] U.S. Department of Energy (DOE): https://www.energy.gov/femp/articles/retro-commissioning-increases-data-center-efficiency-low-cost
[4] National Institute of Standards and Technology (NIST) Technical Note 1848: https://nvlpubs.nist.gov/nistpubs/technicalnotes/nist.tn.1848.pdf
The biggest win in the OpEx vs. CapEx battle is sharing knowledge. Join the conversation and tell us: What is the most reliable metric you use to justify major HVAC replacements to your finance team? Drop your best budgeting tips, biggest challenges, and Crossover Point success stories in the comments below!

